

$CVNA Weekly Report: 11/20 to 11/26 - Free
$CVNA Weekly Report: 11/20 to 11/26 - Free
Intro:
Sales Data:
Weekly Sales: 5,372 (-1,135, -17% WoW)(-332, -6% YoY)
Weekly Orders: 7,850 (-17% WoW)
Weekly ASP (Adj): $23,397 (% WoW)
Weekly List Price (Raw): $26,256
Q4 Unit Run Rate: Premium Subscribers Only
Q4 Vehicle Revenue Run Rate: $1,656,188,548
Weekly Commentary:
The week of Thanksgiving is clearly not conducive to selling cars. That being said, it went relatively well compared to last year, posting the best YoY weekly comp of the quarter. Additionally, we believe orders held up better than last year being down only ~17% WoW into Thanksgiving while 2022 saw sales decline >20% in the weeks following Thanksgiving vs the weeks prior. Early data from this week contains numerous positive comps which may lead to the first week of YoY growth for CVNA all year. We outlined the logic for this previously - 2022 saw a unique slowdown later in Q4 as the business focused on restructuring costs post the Q3 earnings report, starting around October/November. This likely lead to unique sales weakness beyond normal seasonality. Said unique weakness is obviously not continuing in 2023, hence much easier comps going forward for units.
Still early days and certainly going to see a QoQ decline in units sold given seasonality, but positive trends for the first time at CVNA unit wise.
For full data and ongoing access to our subscriber commentary, data files, and emails, feel free to subscribe below or reach out.
Job Postings:
Total positions were 520, down from 525 as of last week.
Market Operations: 176 (-1 WoW)
Reconditioning: 105 (+2 WoW)
Auction: 67 (-1 WoW)
Logistics: 45 (+1 WoW)
Mechanical: 22 (+2 WoW)
As a reminder, in recent weeks we’ve seen a significant slowdown in job postings from CVNA compared to 2 months ago. This matches with data from 2022, however said data is complicated by the business restructuring at the time as well as the integration of ADESA into job postings. It does seem like CVNA seasonally lessens hiring into Q4 as they instead work on training ahead of the next years tax season.
Logistics and ASP’s:
Our ASP estimate for last week was $23,397, a 1% increase versus the prior week. We continue to see ASP’s more bouncing around instead of the strict declines in late Q3. For visual reference:

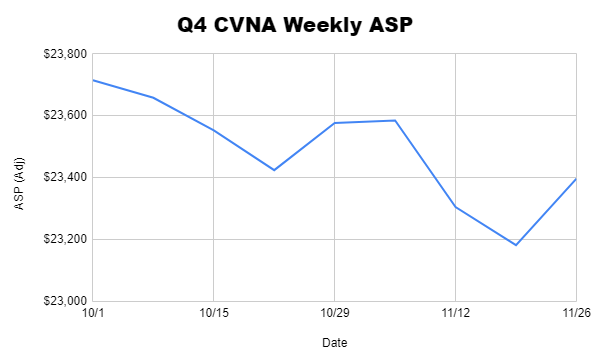
Still a downwards trend, but more variance.
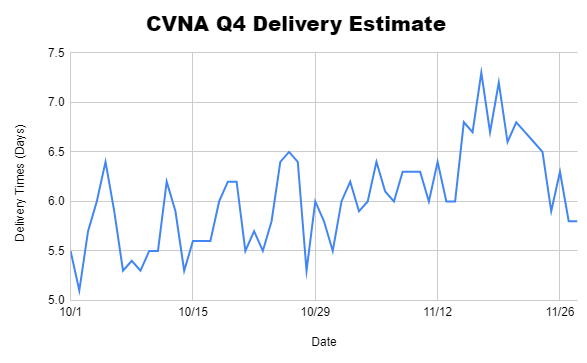
Delivery estimates had their first downwards trending week in a while, now at 6.5 days on average. It will be interesting to see if this is seasonal in nature as there isn’t a clear reason as to why it has been increasing in recent weeks. The decline this week at least in part is likely due to weaker forward orders from Thanksgiving and Black Friday.
Here’s how it’s progressed over the quarter.
11/15 Inventory Snapshot Data:
You can find a link to our sheet tracking inventory snapshots here (premium exclusive)
Interesting stats:
Total inventory is up ~1.7% over the past 1.5 months. This is somewhat interesting given an overall weaker seasonal market, which is likely part of why we’ve seen days to sale extend a bit recently.
Listed prices are down 0.8%, however KBB prices are down 1.8%. This likely indicates CVNA is getting a mix of slightly better than competitor pricing as well as declines in the wholesale market which should buoy retail GPU a bit to offset price declines.
The average price of vehicles pending sale is down a bit more to -2.9%. This could indicate that consumers are erring towards lower priced vehicles, or that CVNA is intentionally selling down some portions of inventory. Longer times to sale would also negatively impact this metric as vehicles would depreciate more before selling despite similar overall list prices.
The average model year is 2018.1, the same as last run, indicating CVNA’s inventory is slightly older on average.
Vehicles that CVNA has acquired more recently have a rather substantial price difference now, with newer than average vehicles priced at $24,776 vs $23,573 for older than average ones. This is rather abnormal that CVNA is going significantly more expensive on newer vehicles as we’ve generally seen flat or down so far this year.
Spreads between listed price and KBB values for newer model years continues to be very volatile. Honestly not sure why.
Geographic distribution of inventory has held relatively constant with the only real difference being Delanco, NJ up and Haines City, FL down, both by about 15-20%.
Inventory distribution does continue to become more diverse with the top 15 locations only accounting for 62% of inventory vs 64% 45 days ago.
Markets are not homogenous in how they’re handling inventory strategy. Rocklin for example has seen prices fall 5.5% vs only 0.8% on average. This appears largely explainable by mix as the vehicles there have gotten older and higher mileage, indicating an intentional shift in inventory exposure for that market.
Each states share of pending inventory is a good indicator of geographic distribution of sales. This months data is practically similar to last month besides TX being down about 10%.
Inventory composition by make and model continues to be relatively steady with the Chevy Equinox and Ford Mustang continuing to take the top spots.
Overall inventory data is holding quite steady, which makes sense given much of the turbulence was worked through earlier this year in terms of selling down inventory and redoing their footprint.
We encourage readers to look through the data files themselves for more specifics and with any questions feel free to reach out.
Additional Tracking: KMX
As a reminder of 2 weeks ago noted changes
We scrape this data from the KMX Website as listed APR ranges for different credit scores. Actual rates will vary due to down payments, terms, and individual factors, but we hope this should capture general APR upticks:
Old:
Excellent (800+ FICO): 4.95% min, 7.95% max, 5.5% median
Very Good (740-799 FICO): 6.45% min, 9.95% max, 7.5% median
Good (670-739 FICO): 9.95% min, 14.95% max, 11% median
Fair (580-669 FICO): 13.95% min, 28% max, 16% median
Challenged (579- FICO): 18% min, 28% max, 24% median
New
Excellent (800+ FICO): 5.75% min, 8.95% max, 6.95% median
Very Good (740-799 FICO): 7.95% min, 11.95% max, 8.95% median
Good (670-739 FICO): 10.95% min, 15.95% max, 12.95% median
Fair (580-669 FICO): 14.95% min, 29% max, 17.95% median
Challenged (579- FICO): 17.95% min, 29% max, 23.95% median
As shown rates obviously increased. What’s interesting is that lower end FICO’s are holding relatively steady, likely due to a mix of usury laws and weaker demand. We’d imagine this is true for CVNA as well given VRM and KMX have seen rising rates over the past 45 days or so, but don’t have clean data as we do with the others.
Closing:
Feel free to subscribe or reach out