$CVNA Report: 5/27 to 6/9 - Free
We’re providing a one time free update on Q2 due to significant continued growth from CVNA. If you are interested in further coverage, subscribe below.
Intro:
5/27 to 6/2
Weekly Sales: 7,744 (-362, -5% WoW)(+1,963, +34% YoY)
Weekly Orders: 10,297 (-2% WoW)
Weekly ASP (Adj): $24,169 (+1% WoW)
Weekly List Price (Raw): $26,811
Q2 Unit Run Rate: 100,347 (+33% YoY)
Q2 Vehicle Revenue Run Rate: $2,424,420,688
6/3 to 6/9
Weekly Sales: 7,613 (-131, -2% WoW)(+1,617, +27% YoY)
Weekly Orders: 10,877 (+6% WoW)
Weekly ASP (Adj): $24,239 (+0% WoW)
Weekly List Price (Raw): $26,307
Q2 Unit Run Rate: 99,852 (+32% YoY)
Q2 Vehicle Revenue Run Rate: $2,415,256,150
Weekly Commentary:
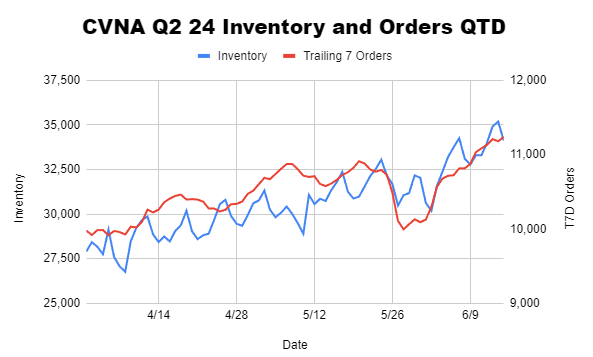
Starting last week Trailing 7d Orders has reversed course upwards. That trend has continued into the week of 06/10-06/16 which will likely set a new consecutive quarterly high in weekly orders. This comes along side an inventory ramp that has been happening throughout the quarter due to a mix of more CVNA listed vehicles as well as partner inventory. Trailing 7 day orders are currently about 13% higher than at the start of the quarter while inventory is about 21% higher.
As a result, we’d expect the coming weeks to start materially outperforming 2023 YoY comps.
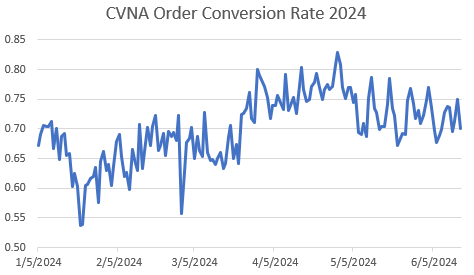
Conversion rates on orders are slightly lower from the ramp we saw through tax season, but still meaningfully higher than the start of the year and the values we saw in 2023 which were closer to high 50% low 60% at this time in 2023.
Job Postings:
Total positions are 753, +87 from last update.
Market Operations: 243 (+93)
Reconditioning: 192 (-41)
Logistics: 90 (+34)
Auction: 65 (+3)
Mechanical: 16 (-1)
Overall the trend is rather clear, CVNA is hiring substantially more in roles directly related to vehicle delivery. This makes some sense as 3P partner inventory does not require similar reconditioning and sometimes doesn’t appear to be reconditioned at all (by CVNA). Additionally, we saw reconditioning postings spike about 4-6 months ago and I would assume it is a role that is harder to rapidly spin up and down. Many of these market operations and logistics hires are done via rapid hiring events whereas we haven’t typically seen similar events for reconditioning.
Logistics and ASP’s:
Our ASP estimate for last week was $24,239, a 0% increase versus the prior week, but right in line with QTD average. Relatively stable prices are likely a boon for them compared to late 2023, but YoY will have some pressure given there was appreciation in Q2 last year.
Delivery estimates on average were 4.0 days last week, coming down from the holiday backlogs, but still up slightly from earlier in the quarter. It is quite impressive the progress made here as I’d highlight the current T7D order count is at quarter highs while YoY delivery times are down 3.5-4 days on average despite increased sales volumes this year.
5/15 Inventory Snapshot Data:
Reminder: You can find a link to our sheet tracking inventory snapshots if you are a premium subscriber.
Interesting stats:
Total inventory is up 11% over the past 1.5 months as of 5/15. This is somewhat expected as we exited tax season, however it is also due to more CVNA partner inventory entering the ecosystem which boosts inventory levels.
Listed prices are up 2% and listed KBB’s are up 2%, so CVNA margins likely relatively similar despite the ASP increases.
The average model year is 2018.4, a slight tick newer compared to the last snapshot which explains some of the ASP increases.
Spreads between listed price and KBB values for newer model years continues to be very volatile. Honestly not sure why. Spreads are improving on newer model years relative to older ones. (largely due to partner inventory which is interesting, suggesting margins may still be quite good on partner inventory)
Geographic distribution of inventory has held relatively constant once again. OH took back the #1 spot from CA as the largest share of current inventory, but relative moves aren’t super notable. This may start to shift later in the year or in 2025/2026 as CVNA resumes more CapEx spend.
In terms of concentration by make, we are seeing the top 10 makes holding relatively steady at around 65% of inventory. We noted last report that Tesla concentration was up, which is still true relative to previous periods, but down since the last report, suggesting CVNA’s gains from EV’s has stabilized.
Markets are not homogenous in how they’re handling inventory strategy with prices between different states varying by >10%.
Each states share of pending inventory is a good indicator of geographic distribution of sales. Previously this was TX>CA>GA, but CA took over for awhile. As of this report TX is back on top. This may be a function of significantly depressed spreads in California or simply noise. Overall spreads are slightly up by about $40 while CA spreads are down ~$400
We encourage readers to look through the data files themselves for more specifics and with any questions feel free to reach out.
Additional Tracking: KMX
We scrape this data from the KMX Website as listed APR ranges for different credit scores. Actual rates will vary due to down payments, terms, and individual factors, but we hope this should capture general APR upticks:
Excellent (800+ FICO): 5.75% min, 8.95% max, 6.95% median
Very Good (740-799 FICO): 7.95% min, 11.95% max, 8.95% median
Good (670-739 FICO): 10.95% min, 15.95% max, 12.95% median
Fair (580-669 FICO): 14.95% min, 29% max, 17.95% median
Challenged (579- FICO): 17.95% min, 29% max, 23.95% median
No changes once again.
Closing:
Feel free to subscribe or reach out


